Brazil’s overseas election was far from uniform. Flávio Bolsonaro won decisively in the United States and Japan, while Lula led in Germany, France and Portugal. Across all overseas areas, Lula received 53.86% of valid votes. This overview brings together country results, first-round comparisons and turnout.
We checked all 186 overseas reporting areas in the TSE dataset and grouped them by country. One important exception remains explicit: Belgium and Luxembourg are shown together because the result data used here combine them under “Brussels”. France includes French Guiana, and China includes Hong Kong. Taiwan and the Palestinian territories are separately labelled. The tables cover the entire published overseas dataset without inventing separate country values from combined returns.
Dedicated country articles: United Kingdom, Canada, United States, Germany, Austria and Switzerland. Jump to the full country table.
The US, Portugal and Japan supplied almost half of overseas valid votes
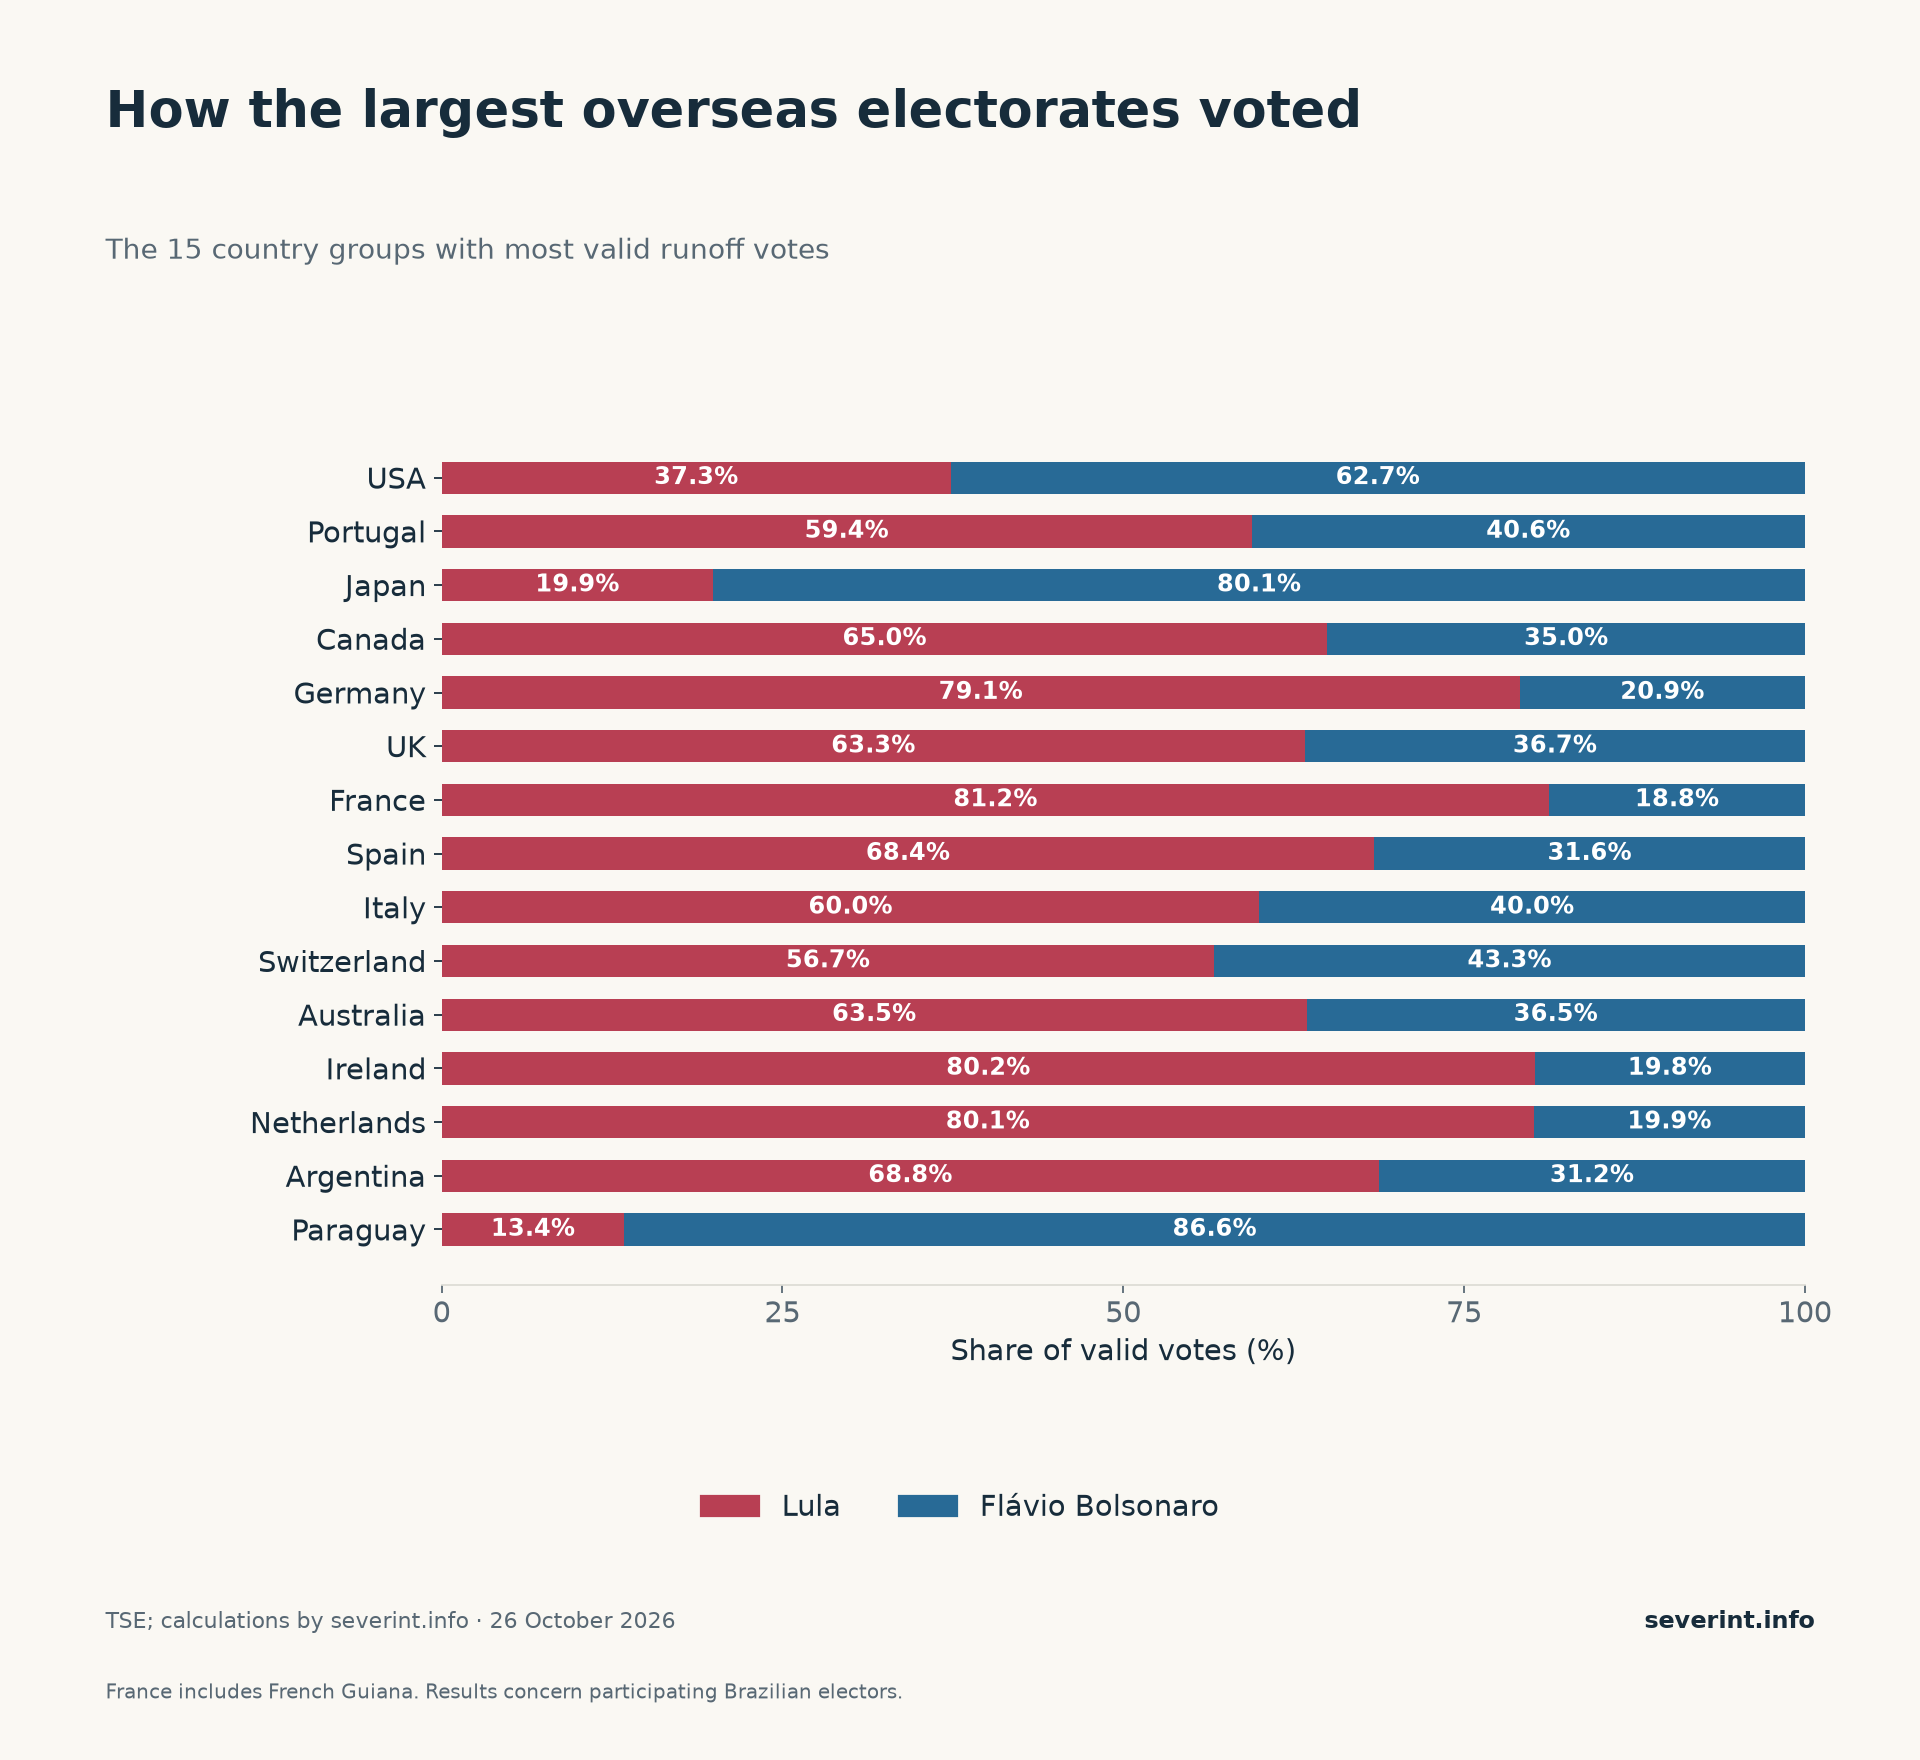
The United States recorded 85,741 valid votes, the largest overseas total. Portugal followed with 57,752 and Japan with 35,636. Together they supplied 48.20% of all valid overseas votes. Politically, they differed sharply: Bolsonaro won the US with 62.65% and Japan with 80.08%, while Lula won Portugal with 59.42%.
A country average can also hide substantial local variation. Lula received just 23.36% in the Miami reporting area, but 52.40% in New York. TSE reporting areas may contain several actual polling locations. Their names are administrative labels rather than results for entire city populations.
Germany supplied Lula’s largest overseas country surplus
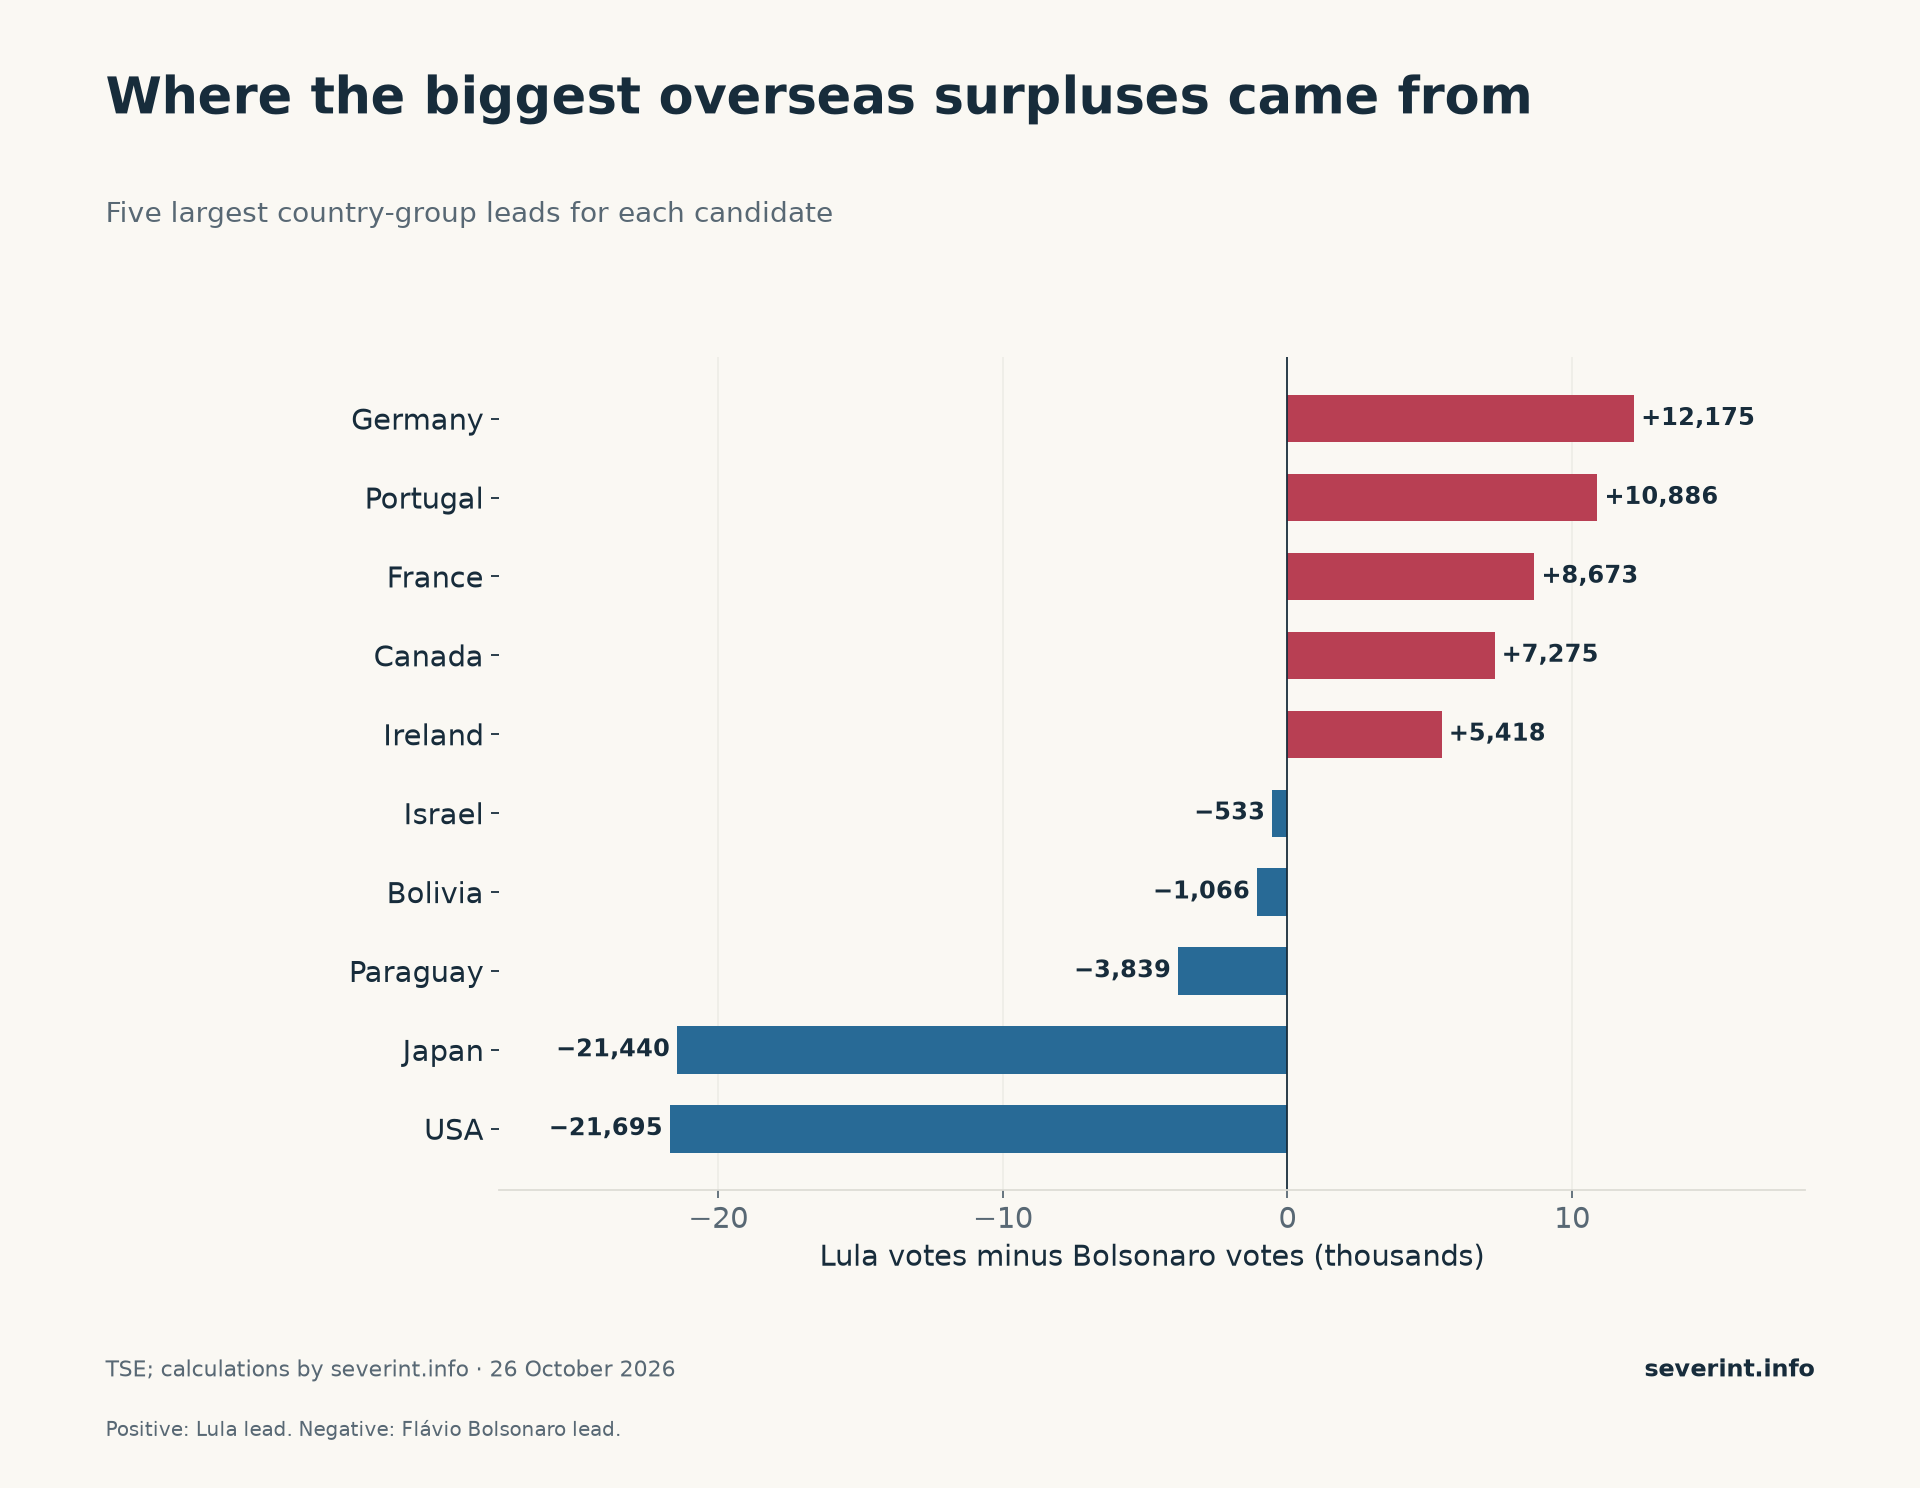
Germany supplied Lula with his largest positive country balance abroad: 12,175 votes. Portugal followed with 10,886, France including French Guiana with 8,673, and Canada with 7,275. Bolsonaro’s largest surpluses came from the US, at 21,695 votes, and Japan, at 21,440.
The entire overseas electorate gave Lula a net lead of 28,657 votes. That was a small contribution compared with his national margin of 4,430,191. Overseas votes represented about 0.30% of all valid runoff votes. These results are informative about geographical differences, but their weight in the national arithmetic was limited.
Paraguay and Japan stand out for Bolsonaro
Among country groups with at least 1,000 valid votes, Paraguay was particularly favourable to Bolsonaro: he won 86.60%. Japan followed with 80.08%. Lula’s stronger results included Denmark at 85.06%, France at 81.25%, Ireland at 80.20% and the Netherlands at 80.13%. In the Ramallah reporting area, listed here under the Palestinian territories, he received 95.60% of 1,046 valid votes.
Smaller results require still greater care. Cuba, for example, recorded 43 votes for Lula out of 44 valid votes. The large percentage describes a very small participating group. The table therefore shows vote counts alongside shares and should not be read as a representative poll of all Brazilians in each country.
Overseas turnout rose to 41.63%
Participation abroad increased from 341,766 in the first round to 381,443 in the runoff. Turnout rose from 37.31% to 41.63%, using the registers of polling sections that were actually established. A further 423 entries belonging to sections that were not established are treated separately.
Lula increased his overseas vote total from 157,387 to 200,154, and Bolsonaro from 143,900 to 171,497. Other candidates had received 29,595 valid first-round votes. Valid overseas votes also increased, from 330,882 to 371,651. The finalists’ gains therefore cannot simply be described as transfers from eliminated candidates.
All country results at a glance
The alphabetical table covers every country group with valid runoff votes. “L/B, round 1” gives Lula’s and Bolsonaro’s percentages of all first-round valid votes; the remaining share went to other candidates. The runoff columns show votes and shares. Turnout refers to the runoff. On smaller screens, scroll the table horizontally.
| Country / area | L/B, round 1 | Lula, runoff | Bolsonaro, runoff | Valid votes | Turnout |
|---|---|---|---|---|---|
| Algeria | 87.10 / 9.68% | 23 88.46% |
3 11.54% |
26 | 60.42% |
| Angola | 55.68 / 38.26% | 167 58.60% |
118 41.40% |
285 | 40.36% |
| Argentina | 64.44 / 28.91% | 4,466 68.77% |
2,028 31.23% |
6,494 | 50.92% |
| Australia | 56.12 / 31.73% | 6,017 63.46% |
3,465 36.54% |
9,482 | 48.30% |
| Austria | 66.55 / 21.14% | 1,178 74.98% |
393 25.02% |
1,571 | 51.77% |
| Bahamas | 31.58 / 52.63% | 6 30.00% |
14 70.00% |
20 | 31.88% |
| Bahrain | 36.17 / 57.45% | 11 28.21% |
28 71.79% |
39 | 60.87% |
| Belgium / Luxembourg | 50.57 / 39.38% | 3,064 58.72% |
2,154 41.28% |
5,218 | 52.86% |
| Bolivia | 19.00 / 75.50% | 409 21.71% |
1,475 78.29% |
1,884 | 53.62% |
| Bulgaria | 72.34 / 17.02% | 40 75.47% |
13 24.53% |
53 | 56.12% |
| Cabo Verde | 55.71 / 28.57% | 48 62.34% |
29 37.66% |
77 | 55.48% |
| Canada | 57.75 / 32.52% | 15,776 64.98% |
8,501 35.02% |
24,277 | 54.01% |
| Chile | 47.08 / 41.05% | 1,100 53.76% |
946 46.24% |
2,046 | 59.99% |
| China including Hong Kong | 56.37 / 31.18% | 502 65.28% |
267 34.72% |
769 | 37.31% |
| Colombia | 46.49 / 47.82% | 281 49.82% |
283 50.18% |
564 | 38.68% |
| Costa Rica | 46.76 / 42.97% | 180 49.18% |
186 50.82% |
366 | 52.94% |
| Croatia | 60.42 / 35.42% | 31 54.39% |
26 45.61% |
57 | 43.38% |
| Cuba | 94.74 / 2.63% | 43 97.73% |
1 2.27% |
44 | 48.91% |
| Cyprus | 42.11 / 35.09% | 29 53.70% |
25 46.30% |
54 | 42.34% |
| Czechia | 70.28 / 17.63% | 304 77.95% |
86 22.05% |
390 | 58.84% |
| Côte d’Ivoire | 54.55 / 29.55% | 31 58.49% |
22 41.51% |
53 | 58.24% |
| Denmark | 79.00 / 13.21% | 1,383 85.06% |
243 14.94% |
1,626 | 58.74% |
| Dominican Republic | 34.57 / 56.38% | 90 43.27% |
118 56.73% |
208 | 50.84% |
| Ecuador | 39.63 / 52.13% | 158 46.06% |
185 53.94% |
343 | 35.55% |
| Egypt | 71.88 / 18.75% | 60 78.95% |
16 21.05% |
76 | 38.92% |
| El Salvador | 29.87 / 62.34% | 26 34.67% |
49 65.33% |
75 | 49.07% |
| Estonia | 74.74 / 10.00% | 160 82.90% |
33 17.10% |
193 | 63.21% |
| Finland | 68.54 / 22.37% | 550 74.83% |
185 25.17% |
735 | 59.15% |
| France | 75.27 / 18.51% | 11,275 81.25% |
2,602 18.75% |
13,877 | 43.14% |
| Germany | 71.93 / 18.79% | 16,549 79.09% |
4,374 20.91% |
20,923 | 51.59% |
| Ghana | 61.54 / 15.38% | 8 61.54% |
5 38.46% |
13 | 32.56% |
| Greece | 39.68 / 46.56% | 255 45.05% |
311 54.95% |
566 | 47.98% |
| Guatemala | 27.97 / 56.78% | 43 36.13% |
76 63.87% |
119 | 42.25% |
| Guinea-Bissau | 45.95 / 45.95% | 19 46.34% |
22 53.66% |
41 | 46.59% |
| Guyana | 13.21 / 81.13% | 8 14.55% |
47 85.45% |
55 | 31.46% |
| Haiti | 100.00 / 0.00% | 6 75.00% |
2 25.00% |
8 | 24.24% |
| Honduras | 28.81 / 57.63% | 20 31.25% |
44 68.75% |
64 | 42.76% |
| Hungary | 71.34 / 20.04% | 355 75.21% |
117 24.79% |
472 | 59.58% |
| India | 47.54 / 44.26% | 33 57.89% |
24 42.11% |
57 | 29.59% |
| Indonesia | 25.81 / 61.29% | 15 39.47% |
23 60.53% |
38 | 22.09% |
| Iran | 56.00 / 44.00% | 16 59.26% |
11 40.74% |
27 | 62.22% |
| Ireland | 72.60 / 18.79% | 7,194 80.20% |
1,776 19.80% |
8,970 | 54.33% |
| Israel | 13.07 / 74.29% | 166 19.19% |
699 80.81% |
865 | 26.20% |
| Italy | 53.02 / 37.83% | 7,921 59.99% |
5,283 40.01% |
13,204 | 34.86% |
| Jamaica | 21.05 / 73.68% | 5 31.25% |
11 68.75% |
16 | 16.50% |
| Japan | 15.27 / 71.76% | 7,098 19.92% |
28,538 80.08% |
35,636 | 42.60% |
| Jordan | 86.21 / 7.54% | 725 90.51% |
76 9.49% |
801 | 55.47% |
| Kenya | 56.52 / 36.96% | 29 64.44% |
16 35.56% |
45 | 40.91% |
| Kuwait | 73.97 / 16.44% | 62 78.48% |
17 21.52% |
79 | 60.87% |
| Lebanon | 65.36 / 29.31% | 2,736 68.20% |
1,276 31.80% |
4,012 | 46.64% |
| Malaysia | 53.66 / 32.93% | 41 48.24% |
44 51.76% |
85 | 52.35% |
| Mexico | 45.53 / 45.84% | 699 51.51% |
658 48.49% |
1,357 | 34.96% |
| Morocco | 71.43 / 14.29% | 31 83.78% |
6 16.22% |
37 | 35.04% |
| Mozambique | 41.59 / 52.80% | 108 48.00% |
117 52.00% |
225 | 41.91% |
| Namibia | 46.15 / 38.46% | 8 66.67% |
4 33.33% |
12 | 32.43% |
| Nepal | 7.69 / 84.62% | 1 7.69% |
12 92.31% |
13 | 40.62% |
| Netherlands | 73.70 / 17.23% | 5,578 80.13% |
1,383 19.87% |
6,961 | 55.58% |
| New Zealand | 70.48 / 19.28% | 418 80.54% |
101 19.46% |
519 | 16.86% |
| Nicaragua | 47.83 / 50.72% | 30 43.48% |
39 56.52% |
69 | 55.97% |
| Nigeria | 81.25 / 18.75% | 32 86.49% |
5 13.51% |
37 | 45.12% |
| Norway | 66.97 / 22.40% | 820 76.78% |
248 23.22% |
1,068 | 50.09% |
| Oman | 33.33 / 55.56% | 10 31.25% |
22 68.75% |
32 | 35.05% |
| Palestinian territories | 93.17 / 3.98% | 1,000 95.60% |
46 4.40% |
1,046 | 50.07% |
| Panama | 35.87 / 51.06% | 267 38.36% |
429 61.64% |
696 | 51.61% |
| Paraguay | 11.97 / 84.39% | 703 13.40% |
4,542 86.60% |
5,245 | 58.28% |
| Peru | 33.97 / 52.05% | 297 41.19% |
424 58.81% |
721 | 45.98% |
| Philippines | 41.94 / 53.23% | 27 40.91% |
39 59.09% |
66 | 28.82% |
| Poland | 64.89 / 23.05% | 268 75.07% |
89 24.93% |
357 | 48.40% |
| Portugal | 52.45 / 38.57% | 34,319 59.42% |
23,433 40.58% |
57,752 | 43.93% |
| Qatar | 41.18 / 48.46% | 159 44.92% |
195 55.08% |
354 | 47.83% |
| Romania | 50.00 / 35.48% | 40 61.54% |
25 38.46% |
65 | 50.77% |
| Russia | 60.49 / 30.86% | 60 64.52% |
33 35.48% |
93 | 38.49% |
| Saudi Arabia | 62.65 / 26.51% | 49 61.25% |
31 38.75% |
80 | 27.01% |
| Senegal | 64.56 / 30.38% | 59 72.84% |
22 27.16% |
81 | 61.36% |
| Serbia | 62.50 / 27.08% | 35 72.92% |
13 27.08% |
48 | 44.35% |
| Singapore | 54.60 / 26.44% | 213 63.77% |
121 36.23% |
334 | 40.97% |
| Slovakia | 60.34 / 22.41% | 47 77.05% |
14 22.95% |
61 | 49.62% |
| Slovenia | 62.24 / 25.51% | 67 70.53% |
28 29.47% |
95 | 61.35% |
| South Africa | 36.28 / 54.89% | 186 42.08% |
256 57.92% |
442 | 45.45% |
| South Korea | 56.94 / 33.33% | 148 64.35% |
82 35.65% |
230 | 49.07% |
| Spain | 62.63 / 28.78% | 9,293 68.42% |
4,289 31.58% |
13,582 | 34.31% |
| Suriname | 22.41 / 67.78% | 172 30.82% |
386 69.18% |
558 | 40.28% |
| Sweden | 69.69 / 19.88% | 2,127 78.26% |
591 21.74% |
2,718 | 57.09% |
| Switzerland | 47.86 / 41.69% | 7,089 56.68% |
5,419 43.32% |
12,508 | 47.71% |
| Syria | 89.81 / 6.48% | 106 90.60% |
11 9.40% |
117 | 15.35% |
| Taiwan | 35.32 / 49.08% | 94 41.96% |
130 58.04% |
224 | 38.42% |
| Tanzania | 68.75 / 31.25% | 11 64.71% |
6 35.29% |
17 | 50.00% |
| Thailand | 40.40 / 51.52% | 56 48.28% |
60 51.72% |
116 | 38.06% |
| Timor-Leste | 34.78 / 58.70% | 18 35.29% |
33 64.71% |
51 | 58.43% |
| Trinidad and Tobago | 21.05 / 52.63% | 9 42.86% |
12 57.14% |
21 | 27.27% |
| Tunisia | 54.55 / 40.91% | 16 69.57% |
7 30.43% |
23 | 48.94% |
| Türkiye | 69.51 / 22.56% | 127 77.44% |
37 22.56% |
164 | 41.09% |
| Ukraine | 17.39 / 82.61% | 3 15.79% |
16 84.21% |
19 | 32.31% |
| United Arab Emirates | 37.79 / 48.63% | 643 45.44% |
772 54.56% |
1,415 | 49.03% |
| United Kingdom | 57.03 / 35.42% | 10,968 63.34% |
6,349 36.66% |
17,317 | 42.06% |
| United States | 31.68 / 61.10% | 32,023 37.35% |
53,718 62.65% |
85,741 | 32.98% |
| Uruguay | 48.27 / 42.46% | 887 52.42% |
805 47.58% |
1,692 | 56.82% |
| Venezuela | 48.85 / 47.71% | 106 43.80% |
136 56.20% |
242 | 23.08% |
| Vietnam | 44.83 / 48.28% | 15 46.88% |
17 53.12% |
32 | 41.46% |
Register entries without valid runoff votes
The following countries or reporting areas also appear in the overseas register but recorded no valid runoff votes. They are not presented above as “0% for both candidates”. Except for Tripoli, every register entry in these groups belongs to a polling section recorded as not established. These are not ordinary non-voting rates.
| Country / reporting area | Runoff register | Explanation |
|---|---|---|
| Albania | 9 | No established polling sections in this register extract |
| Antigua and Barbuda | 1 | No established polling sections in this register extract |
| Armenia | 13 | No established polling sections in this register extract |
| Azerbaijan | 5 | No established polling sections in this register extract |
| Bangladesh | 1 | No established polling sections in this register extract |
| Barbados | 22 | No established polling sections in this register extract |
| Belize | 13 | No established polling sections in this register extract |
| Benin | 8 | No established polling sections in this register extract |
| Bosnia and Herzegovina | 11 | No established polling sections in this register extract |
| Botswana | 10 | No established polling sections in this register extract |
| Burkina Faso | 6 | No established polling sections in this register extract |
| Cameroon | 14 | No established polling sections in this register extract |
| Democratic Republic of the Congo | 27 | No established polling sections in this register extract |
| Equatorial Guinea | 5 | No established polling sections in this register extract |
| Ethiopia | 3 | No established polling sections in this register extract |
| Gabon | 18 | No established polling sections in this register extract |
| Georgia | 29 | No established polling sections in this register extract |
| Guinea | 5 | No established polling sections in this register extract |
| Iraq | 10 | No established polling sections in this register extract |
| Kazakhstan | 13 | No established polling sections in this register extract |
| Libya (Tripoli reporting area) | 30 | No runoff participation; first round: 2 valid votes for Lula. Assigned polling address: Tunis. |
| Malawi | 6 | No established polling sections in this register extract |
| Mali | 5 | No established polling sections in this register extract |
| Myanmar | 6 | No established polling sections in this register extract |
| North Korea | 1 | No established polling sections in this register extract |
| Pakistan | 18 | No established polling sections in this register extract |
| Republic of the Congo | 2 | No established polling sections in this register extract |
| Saint Lucia | 7 | No established polling sections in this register extract |
| Sri Lanka | 12 | No established polling sections in this register extract |
| São Tomé and Príncipe | 18 | No established polling sections in this register extract |
| Togo | 7 | No established polling sections in this register extract |
| Zambia | 25 | No established polling sections in this register extract |
| Zimbabwe | 7 | No established polling sections in this register extract |
What the country grouping can and cannot tell us
TSE results use polling-area or consular-area labels. These are not identical to every voter’s residence and do not always identify the physical polling location. “Brussels”, for example, includes polling locations in both Belgium and Luxembourg. For those two countries, we report only the supported combined result: 3,064 votes to 2,154, or 58.72% to 41.28%.
A register label alone does not establish that an additional polling place was open. Entries labelled Lithuania are attached to principal sections in Copenhagen in the location directory; entries labelled Puerto Rico are attached to Miami. The Tripoli reporting area is assigned to an address in Tunis. We do not turn those entries into separate country results that cannot be extracted from the aggregate returns.
The UK, Canada and the US illustrate why this wider comparison is useful. Lula won 63.34% in the United Kingdom and 64.98% in Canada. Bolsonaro won 62.65% in the United States. Understanding the reasons would require additional evidence about the people voting and those who stayed away.
Data and method
All 186 TSE overseas reporting areas were assigned to 132 country or area groups using their geography and the official polling-location directory. Belgium and Luxembourg form one group; France includes Paris, Marseille, Cayenne and Saint-Georges-de-l’Oyapock. China includes Hong Kong, while Taiwan is shown separately. Tripoli remains an explicitly labelled register area. There are 99 groups with valid runoff votes and 33 without. In both rounds, the groups reconcile with the overseas total for each candidate, valid, blank and invalid votes, participants, non-voters and register entries. First-round figures use TSE candidate and detailed-count CSV files; runoff figures use official result files. Shares use summed valid votes, and turnout uses the round-specific register less entries in sections not established. These are published election results, not estimates of individual voter transfers or a population survey.
Sources: TSE official results portal; Official runoff data; Official overseas runoff total; First-round raw data; Official polling-location directory.
English edition of our German-language analysis.
Data as of 26 October 2026. Calculations and graphics: severint.info. Presidential election only. Figures may not add exactly because of rounding.
Explore the Brazil election series
- Brazil election 2026: where Lula built his winning margin
- Poor for Lula, rich for Bolsonaro? What Brazil’s election data show
- Brazil election in Germany: 79.09% of valid votes went to Lula
- From trailing to winning: where Lula gained between Brazil’s two rounds
- Brazil’s non-voters: where turnout was lowest in the 2026 election
- Jair in 2022, Flávio in 2026: how Bolsonaro’s strongholds changed
- Brazil election 2026: ten numbers that explain the result
- Election fraud in Brazil in 2026? What the data from both rounds show
- Brazil election in Austria: 74.98% of valid votes for Lula
- Brazil election in Switzerland: Lula wins with 56.68%
- Brazil election in the UK: 63.34% for Lula, 42.06% turnout
- Brazil election in Canada: Lula wins 64.98% and leads in all four areas
- Brazil election in the US: Bolsonaro wins 62.65% amid sharp local divides
Leave a Reply